
Tools for monitoring and analyzing the performance of processes available in the docuRob® WorkFlow platform are the basic environment for application administrators and management of the organization's operations. Designed and implemented workflow processes are launched in the target environment supporting the organization in achieving its goals. The processes performed are subject to evaluation through an entire history of their execution. This data allows both monitoring the processes and performing complex analyses in order to optimize them.
Process performance monitoring is essentially a short-term goal aimed at identifying exceptional situations and immediately minimizing their effects on ongoing processes.
Performance analysis is related to the long-term goal of continuously optimizing processes by identifying inefficient elements and trying to develop a new, better version of the process definition.
Workload analysis is focused on planning and organizing human resources whose participation in business processes is an important element of process modeling as well as their implementation and operations. An important feature of this design area is the analysis from the point of view of optimizing the performance parameters of business processes undertaken both at the design and maintenance stages of the application.
The system provides an open and flexible mechanism for accessing execution history through a process data repository. This repository is available in the form of objects (tables and views) of a relational database. The mechanism based on the repository allows any external analytical and reporting tools operating on the database to be connected to the system.
Monitoring process performance
Process monitoring as an activity oriented towards detecting and eliminating the causes of exceptional situations usually concerns one process instance and possibly instances and processes related to it. The subject of diagnostic activities are primarily three elements of the docuRob®WorkFlow platform configuration, namely: (1) the process execution history graph and its tabular form, (2) the values of global variables and process parameters contained in its container , and (3) the graphical process model and the BPQL scripts contained therein that control the execution of activities and process flows.
The process instance execution history graph is compliant with the BPMN 2.02 graphical notation and additionally contains data related to the process processing flow such as time attributes of tasks , flow conditions and event occurrences. Additionally, BPQL expression evaluation allows for verification of scripts as well as flow conditions and events controlling the selection of process paths.
Correct operation of processes requires consistency of their implementation with the logic of the business procedures they support. Verification of this requirement is possible only in cooperation between process designers and users responsible for managing the organization. Given the rich representation of process semantics available in the system, it is necessary to assess the multidimensionality of design information representing different modeling phases.
Below is an example of the process supporting the publication procedure work group modeling the principal aspects of flow semantics presented in the Figures 1 to Figure 5.
The object processed within the individual tasks of the process is the text of a scientific publication, and members of the workgroup roles managed by the process. It may serve as a design pattern of a formally organized publishing procedure. Since the process uses a shared repository of objects , in this case texts of scientific publications , there is no need to represent the data flow within the process.
The publishing procedure provides that the work submitted for review will be subjected to automatic verification of its completeness and relevance of the cited bibliography as well as the linguistic correctness of the publication.
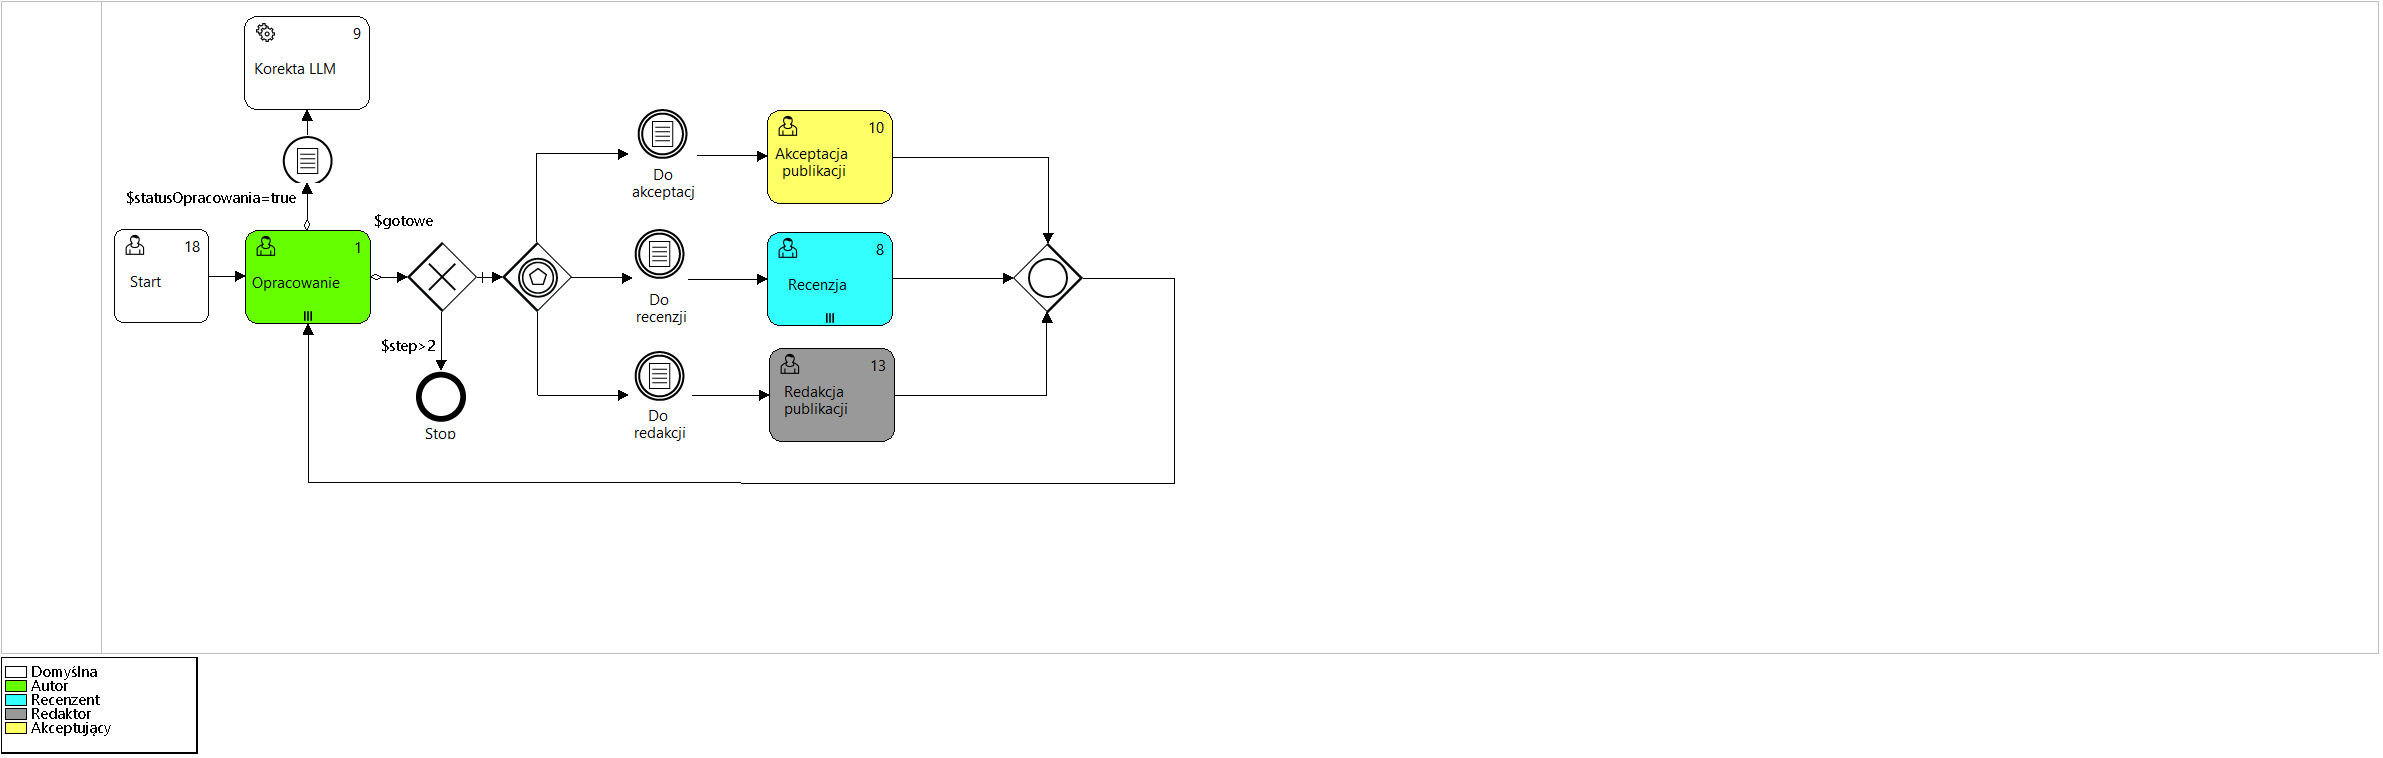
Figure 2. Model of the " Group work " process
Analyzing the presented process model ( Figure 2 ) we can see that after completing the task Development (Outgoing flow OR) with the value true logical global variables $statusDevelopment and $done and the condition defined by the predicate $statusLLM=true AND $doneLLM=false, the automatic analysis of the text of the elaboration will be performed by the LLM (large language model) system. The current values of logical variables are available in the process container (Figure 5 ).
Marking task no. 1 (Development) with the marker ||| means that more than one author may work on the publication in parallel during the multiple activity. The task will be completed after all its participants have completed their work.
Figure 3 shows the color legend of the execution history graph symbols available in the upper right corner of the window. The tabs placed on the lower edge of the graph symbols show the sequencet number of the activity execution and take the color representation of the activity status.
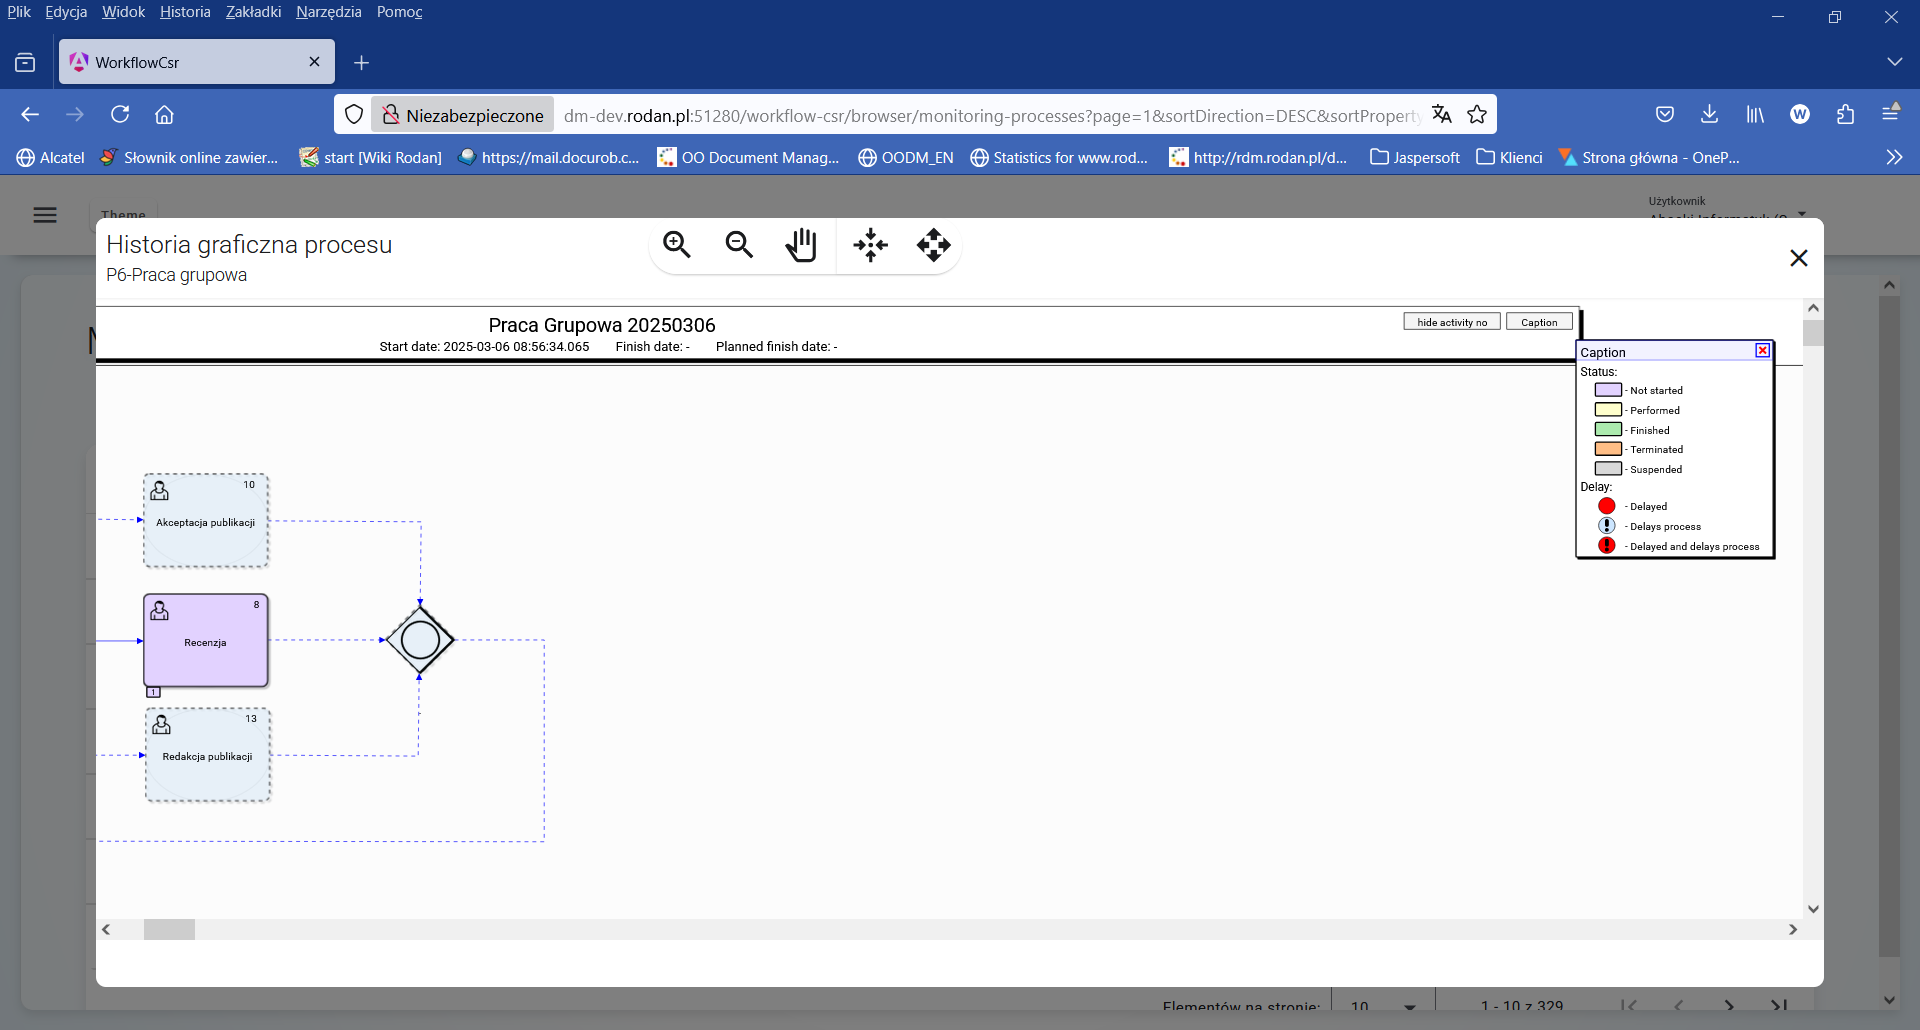
Figure 3. Legend of the color representation of the process state
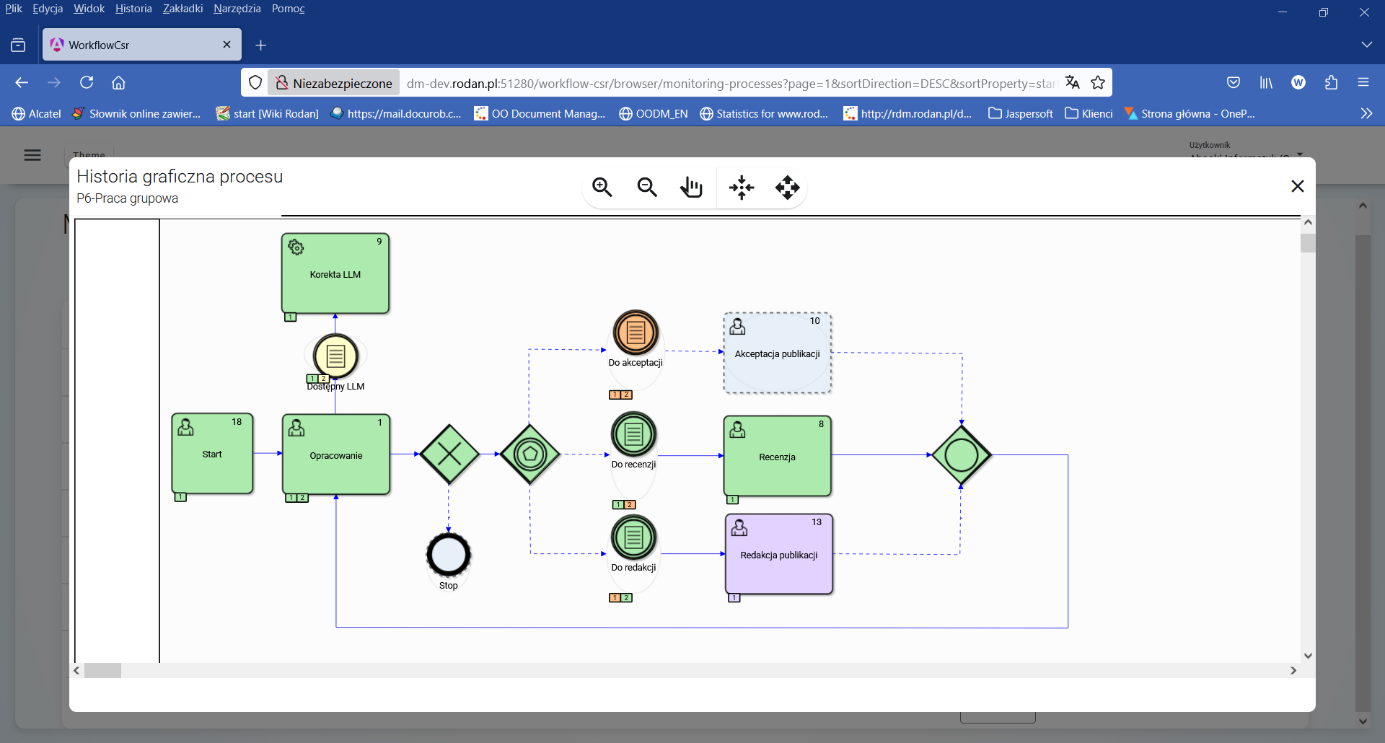
Figure 4. History graph of the execution of the " Groupwork " process instance
Analyzing the execution status of the P6-Groupwork process instance , which is shown in Figure 4 , we can see that 2 iterations of the Development task have already been performed , with the second iteration being performed after the Review step was completed*.* With the appropriate setting of the $doneLLM logical variable , the automatic analysis of the publication text is performed only once before the Review task.
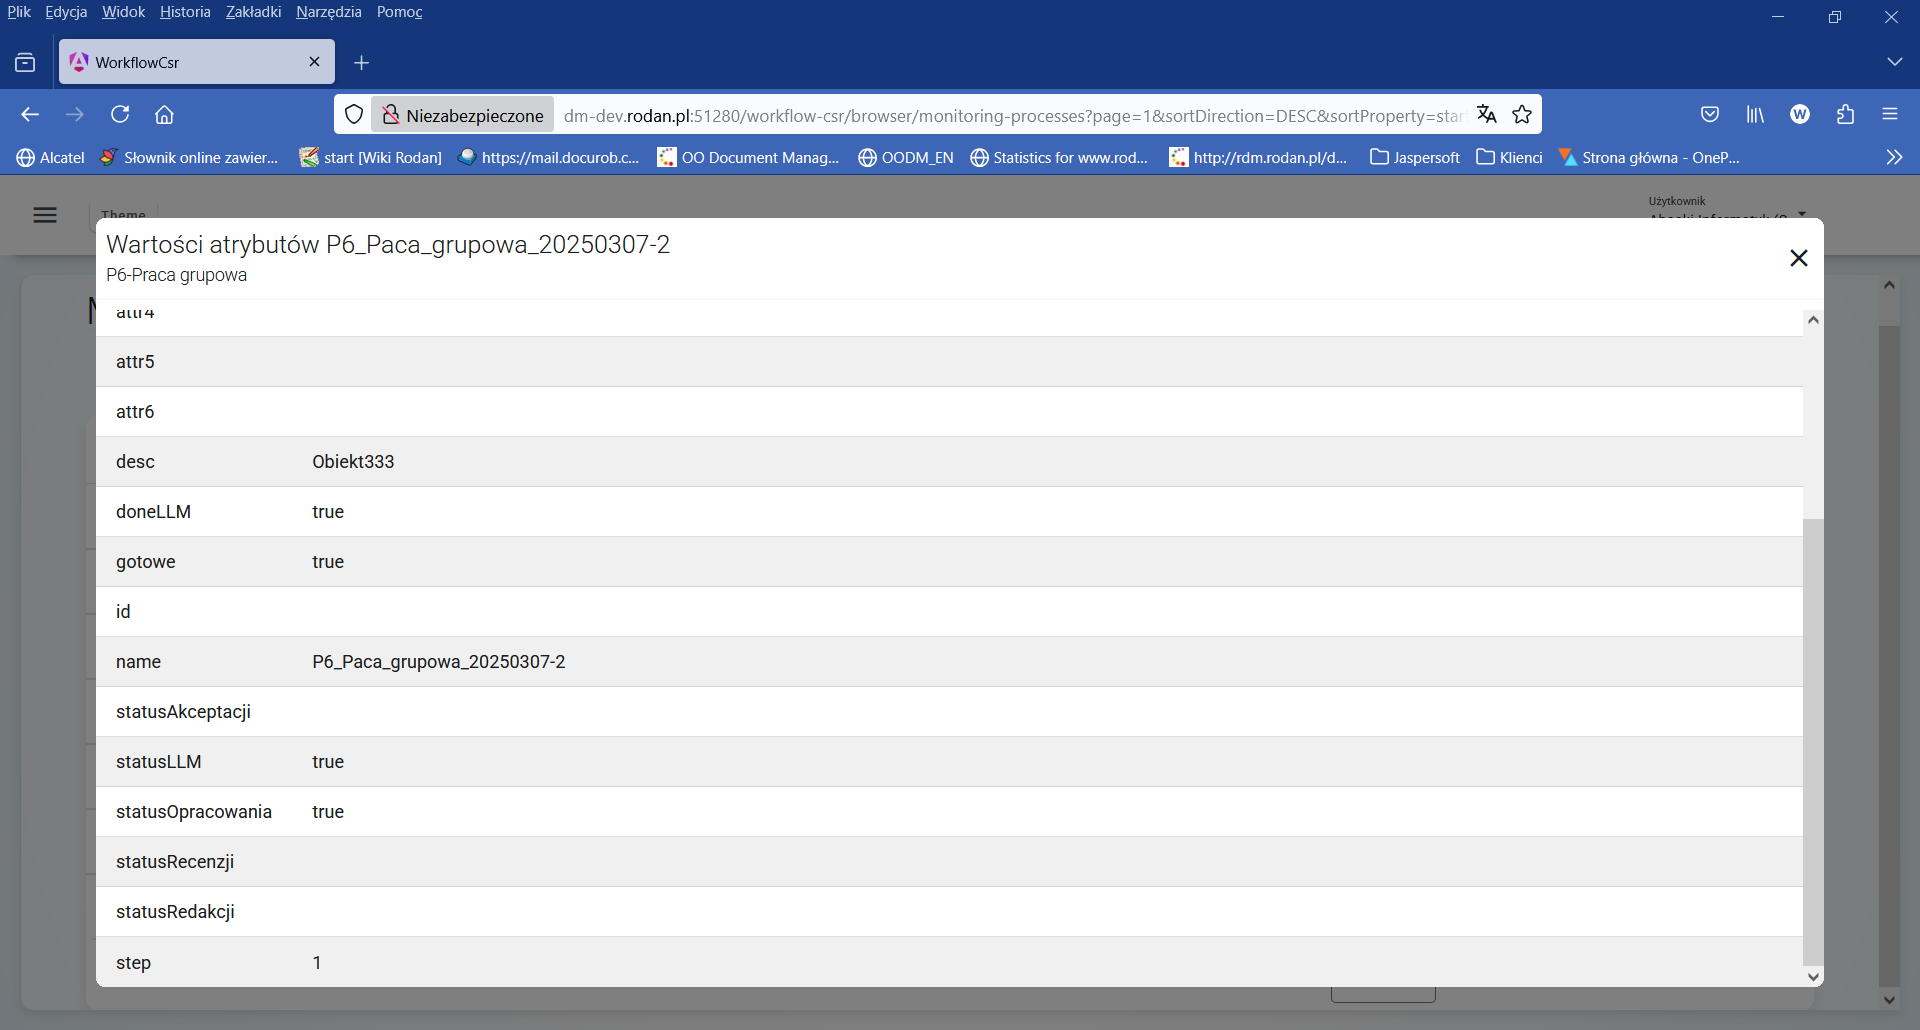
Figure 5. Attribute values of the " Groupwork " process instance
At this point in the process instance state analysis, after executing the first iteration step (value of the $step=1), the process is waiting for the " Publication editing " task to be undertaken by the person holding the " Editor " role.
Process execution analysis
Process Data Repository
The history of executed processes is available in the form of views in the system database. Giving access to them to authorized users allows searching for complex information about processes, while ensuring that this data will be used for retrieval only (no risk related to possible modification of data in the Repository).
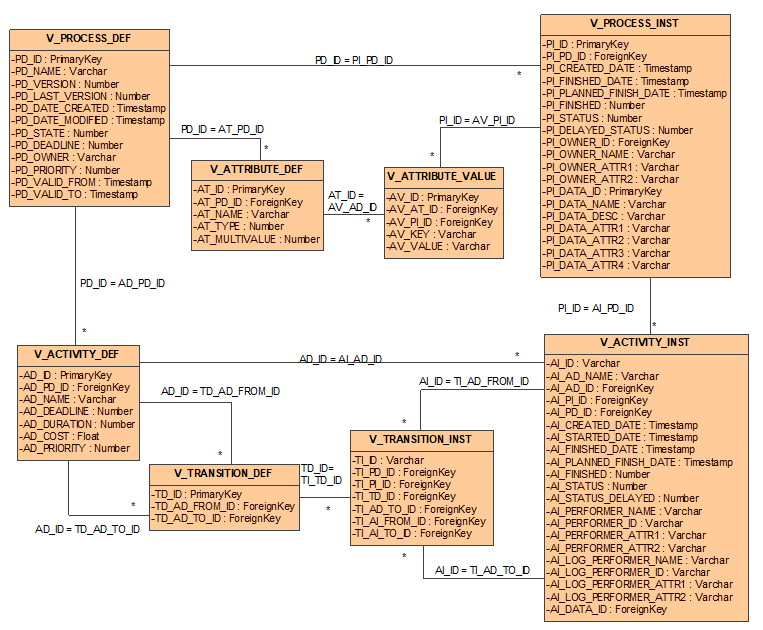
Figure 6. Process database schema views
The data shared concerns process definitions and process instances. This data is consistent with the process metamodel, reflecting its physical structure in the relational database.
Process definitions are available via the V_PROCESS_DEF view. The meaning of the individual fields of this view is shown in Table 1 .
| Field name | Meaning |
|---|---|
| PD_ID | A unique, database-level identifier for the process definition version. |
| PD_NAME | Process name. The name is unique at the process definition level (all its versions). |
| PD_VERSION | The version number of this process definition. Versions are numbered ascending from 1. |
| PD_LAST_VERSION | Specifies whether the given definition is the latest version (value 1) of the process. If not, this field has a value of 0. |
| PD_DATE_CREATED | Date and time the process definition was created in the system. |
| PD_DATE_MODIFIED | Date and time this version of the process definition was last modified. |
| PD_STATE | The status of the process definition. A value of 0 means that the process is being defined or modified. A value of 1 means that the definition is complete and has been released. |
| PD_DEADLINE | The time interval for which a process can execute at most. This interval is given in milliseconds. |
| PD_PRIORITY | Process definition priority. The higher the value, the higher the priority. |
| PD_OWNER | Process owner ID. |
| PD_VALID_FROM | Specifies from when a given definition is valid. |
| PD_VALID_TO | Specifies until when a given definition is valid. |
Table 1. Attributes of the V_PROCESSDEF view
Attributes (variables) of a process are defined via the V_ATTRIBUTE_DEF view. The meaning of the individual fields of this view is given in Table 2 .
| Field name | Meaning |
|---|---|
| AT_ID | A unique process attribute identifier at the database level. |
| AT_PD_ID | The identifier of the process definition to which the attribute belongs. |
| AT_NAME | Attribute name. |
| AT_TYPE | Attribute type name according to the standard types defined in the docuRob® WorkFlow system. |
| AT_MULTIVALUE | A flag indicating whether the attribute is multi-valued (value 1) or single-valued (value 0). |
Table 2. View Attributes V_ATTRIBUTE_DEF
Each activity in the process is represented by the V_ACTIVITY_DEF view ( Table 3 ).
| Field name | Meaning |
|---|---|
| AD_ID | Unique identifier of the activity definition at the database level. |
| AD_PD_ID | The identifier of the process definition to which the activity belongs. |
| AD_NAME | Name of the activity. |
| AD_DEADLINE | The maximum time interval that can elapse from the start of a process instance execution so that the activity is not delayed. This interval is given in milliseconds. |
| AD_DURATION | A time interval representing the maximum time it takes to complete a given activity. This interval is given in milliseconds. |
| AD_PRIORITY | Process definition priority. The higher the number, the higher the priority. |
| AD_COST | Estimated cost of performing an activity. |
Table 3. View Attributes V_ACTIVITY_DEF
Transitions between activities are defined in the V_TRANSITION_DEF table. The meaning of the individual fields of this view is shown in Table 4 .
| Field name | Meaning |
|---|---|
| TD_ID | A unique activity transition identifier at the database level. |
| TD_AD_FROM_ID | The identifier of the activity definition from which the transition is performed. |
| TD_AD_TO_ID | The identifier of the activity definition to which the transition is being made. |
Table 4. View Attributes V_TRANSITION_DEF
Instances of executing processes are represented by the V_PROCESS_INST view ( Table 5 ).
| Field name | Meaning | |
|---|---|---|
| PI_ID | Unique identifier at the database level of the executing process (process instance). | |
| PI_PD_ID | The identifier of the process definition under which the process was started. | |
| PI_CREATED_DATE | Date the process instance was started. | |
| PI_FINISHED_DATE | Process instance end date. | |
| PI_PLANNED_FINISH_DATE | Planned process completion date calculated according to defined time constraints. | |
| PI_FINISHED | A flag indicating whether the process has terminated execution. A value of 0 indicates that the process has not terminated. A value of 1 indicates that the process has terminated. | |
| PI_STATUS | Process execution status. The following values are allowed: 0 – the process instance is running, 1 – the process instance has been completed, 2 – the process instance was interrupted. | |
| PI_DELAYED_STATUS | Process delay status. The following values are allowed: 0 – the process instance is not delayed, 1 – the process instance is delayed. | |
| PI_OWNER_ID | The identifier of the organization employee who owns the process instance. | |
| PI_OWNER_NAME | Name (usually first name, last name and abbreviation of the organizational unit) of the process owner. | |
| PI_OWNER_ATTR1 | Additional attribute no. 1 identifying the process owner as an employee of the organization. The value of this attribute depends on the applications using the docuRob® WorkFlow system. Most often, this attribute represents the identifier of the organizational unit to which the employee belongs | |
| PI_OWNER_ATTR2 | Additional attribute no. 2 identifying the process owner as an employee of the organization. The value of this attribute depends on the applications using the docuRob®WorkFlow system. Most often, this attribute represents the identifier of the organizational unit to which the employee belongs | |
| PI_DATA_ID | Attributes related to application-specific data stored in the docuRob®WorkFlow system for performance reasons. This data is most often used to represent: data displayed and sorted in the task list, identifiers for data used in process rules. | |
| PI_DATA_NAME | ||
| PI_DATA_DESC | ||
| PI_DATA_ATTR1 | ||
| PI_DATA_ATTR2 | ||
| PI_DATA_ATTR3 | ||
| PI_DATA_ATTR4 |
Table 5. Attributes of the V_PROCESS_INST view
Attributes (variables) of the executed process are represented by the V_ATTRIBUTE_VALUE view. The meaning of the individual fields of this view is shown in Table 6 .
| Field name | Meaning |
|---|---|
| AV_ID | Unique attribute identifier of the executed process at the database level. |
| AV_AT_ID | Attribute definition identifier. |
| AV_PI_ID | The identifier of the process instance to which the attribute belongs. |
| AV_KEY | Attribute key value. |
| AV_VALUE | Attribute value. |
Table 6. Attributes of the V_ATTRIBUTE_VALUE view
Activities performed within processes are represented by the V_ACTIVITY_INST view. ( Table 7 ).
| Field name | Meaning |
|---|---|
| AI_ID | A unique identifier of a sentence (activity instance) at the database level. |
| AI_AD_NAME | The name of the activity specified in its definition. |
| AI_AD_ID | Activity definition identifier. |
| AI_PI_ID | The identifier of the process instance within which the activity instance is run. |
| AI_PD_ID | The identifier of the process definition in which the activity was defined. |
| AI_CREATED_DATE | Date the activity instance was created. |
| AI_STARTED_DATE | Date the activity was started by the performer. If the activity has not been started, the value is NULL. |
| AI_PLANNED_FINISH_DATE | The planned completion date of an activity, calculated based on the time constraints defined in the process. |
| AI_FINISHED_DATE | Date when the activity was completed. If the activity was not completed, the value is NULL. |
| AI_FINISHED | Flag indicating whether the task has finished executing. A value of 0 means that the process has not finished. A value of 1 means that the process has finished. |
| AI_STATUS | Task execution status. The following values are allowed: 0 – the task has been started, 1 – the task has been completed, 2 – the task was interrupted, 3 - the task was created but not started. |
| AI_DELAYED_STATUS | Process delay status. The following values are allowed: 0 – the process instance is not delayed, 1 – the process instance is delayed. |
| AI_PERFORMER_ID | The identifier of the organization's employee who is the actual performer of the task. In the case of performing the task as the substitute of another person, the data of the actual performer is entered here. |
| AI_PERFORMER_NAME | Name (usually first name, last name and abbreviation of the organizational unit) of the actual performer of the process. |
| AI_PERFORMER_ATTR1 | Additional attribute no. 1 identifying the actual performer of the process as an employee of the organization. The value of this attribute depends on the applications using the docuRob®WorkFlow system. Most often, this attribute represents the identifier of the organizational unit to which the employee belongs |
| AI_PERFORMER_ATTR2 | Additional attribute no. 2 identifying the actual performer of the process as an employee of the organization. The value of this attribute depends on the applications using the docuRob®WorkFlow system. Most often, this attribute represents the identifier of the organizational unit to which the employee belongs |
| AI_LOG_PERFORMER_ID | The identifier of the organization's employee who is the logical performer of the task. In the case of performing the task in place of another person, the data of the replaced person is entered here. |
| AI_LOG_PERFORMER_NAME | Name (usually first name, last name and abbreviation of the organizational unit) of the logical performer of the process. |
| AI_LOG_PERFORMER_ATTR1 | Additional attribute no. 1 identifying the logical performer of the process as an employee of the organization. The value of this attribute depends on the applications using the docuRob®WorkFlow system. Most often, this attribute represents the identifier of the organizational unit to which the employee belongs |
| AI_LOG_PERFORMER_ATTR2 | Additional attribute no. 2 identifying the logical performer of the process as an employee of the organization. The value of this attribute depends on the applications using the docuRob®WorkFlow system. Most often, this attribute represents the identifier of the organizational unit to which the employee belongs |
| Attributes related to application-specific data stored in the docuRob®WorkFlow system for performance reasons. This data is most often used to represent: data displayed and sorted in the task list, identifiers for data used in process rules. | |
| AI_DATA_ID | Processed data identifier. Same as PI_DATA_ID. |
Table 7. Attributes of the V_ACTIVITY_INST view
The control flow of executing processes is represented by the V_TRANSITION_INST view ( Table 8).
| Field name | Meaning |
|---|---|
| TI_ID | A unique, database-level identifier for the transition instance. |
| TI_PD_ID | The identifier of the process definition to which this transition instance belongs. |
| TI_PI_ID | The identifier of the process instance to which this transition instance belongs. |
| TI_TD_ID | The identifier of the transition definition that this instance represents. |
| TI_AD_FROM_ID | The identifier of the activity definition from which this transition leads. |
| TI_AD_TO_ID | The identifier of the activity definition to which this transition leads. |
| TI_AI_FROM_ID | The identifier of the activity instance from which this transition leads. |
| TI_AI_TO_ID | The identifier of the activity instance to which this transition leads. |
Table 8. Attributes of the V_TRANSITION_INST view
Examples of SQL questions
Based on the database schema views described in the previous section, it is possible to create arbitrary queries regarding the definition or execution of processes. The queries created must comply with the SQL syntax specified in the SQL'89 standard. Some specific constructs are also allowed, depending on the type of database server. Using them can speed up the query or simplify its definition, but it will be more difficult to run them on other types of database servers.
NOTE. The examples described below were prepared for the PostgreSQL server. Most of the queries prepared are universal, but in the case of date operations and explicit data conversion, it was necessary to use specific, built-in functions of the PostgreSQL server. These functions are also available in other relational database servers, but they may differ in name and/or syntax. A problem that a person running the examples below on non-standard database servers may encounter is the use of functions in data aggregation operations. Currently, most known servers support this feature, but it should always be verified based on the documentation of the given server.
Process monitoring
When monitoring processes, we are most often interested in quick identification of anomalies in the processes being performed. For this purpose, maintaining a given level of quality of process execution is verified. This level can be expressed using standard quality parameters such as time or cost or can be defined using definable process indicators saved in the process container (e.g. customer satisfaction level).
Example No. 1
Objective : To determine the maximum, average and minimum delay of performed activities.
Implementation : We will base the implementation of this goal on the following query:
SELECT
MIN(CURRENT_DATE - AI_PLANNED_FINISH_DATE),
	AVG(CURRENT_DATE - AI_PLANNED_FINISH_DATE),
	MAX(CURRENT_DATE - AI_PLANNED_FINISH_DATE)
FROM
	V_ACTIVITY_INST
WHERE
	AI_FINISHED = '0' AND 			-- tasks completed
	Now () > AI_PLANNED_FINISH_DATE 		-- and delayed
This query reads the activity instances exposed via the V_ACTIVITY_INST view that are incomplete and have already had their planned execution time. Standard aggregate functions were used to determine the minimum, average, and maximum delay values.
NOTE. When referring to the current date, the built-in CURRENT_DATE function provided in the PostgreSQL server is used. On other relational database servers, this function may be named differently. The syntax of the query used is specific to the PostgreSQL server. The syntax is different on other types of database servers.
Example No. 2
Purpose : To read the average number of returns made during the execution of a process.
Implementation : In order to perform this task, we will assume that the number of returns is an attribute (variable) of the process container. When a return occurs in the process, this variable is incremented. This variable is named nawrotyIlosc.
We will perform our calculations for processes terminated in the standard way (i.e. not by interrupting the process).
SELECT
PD_NAME,
PD_VERSION,
  avg (AV_VALUE::Integer) -- explicit conversion of a text field to a number
FROM
V_ATTRIBUTE_VALUE, V_ATTRIBUTE_DEF, V_PROCESS_DEF, V_PROCESS_INST
WHERE
AT_NAME = 'recurrencesNumber' AND
PD_ID = AT_PD_ID AND
AV_AT_ID = AT_ID AND
PI_ID = AV_PI_ID AND
PI_FINISHED = 1 AND – only completed processes
PI_STATUS = 1 – only instances completed successfully
GROUP BY
PD_NAME,
PD_VERSION
Since all process attributes (variables) are stored in text form, to count the number of recurrences, you must first cast the attribute value to an integer. The results are grouped by process definitions - by the definition name and version. In order to select only instances of completed processes, conditions for instances completed and successfully completed have been added. The condition " PI_STATUS = 1 " is redundant, but its use will force the use of the index and significantly speed up data retrieval.
NOTE. The syntax of the query used is specific to the PostgreSQL server. In other types of database servers the syntax is different.
Example No. 3
Goal : Preparation of an indicator enabling quick reaction when the number of processes currently being performed and delayed by more than 10 days exceeds 8% of all processes being performed
Implementation : We will perform this task based on two queries to the Process Repository. The first query will count the number of processes being executed that are delayed by more than 10 days.
SELECT
COUNT(*)
FROM
V_ACTIVITY_INST
WHERE
AI_FINISHED = 0 AND
AI_PLANNED_FINISH_DATE < CURRENT_DATE - 10
The second query will count the number of all processes being executed.
SELECT
COUNT(*)
FROM
V_ACTIVITY_INST
WHERE
AI_FINISHED = 0
The ratio of delayed processes to all running processes can be determined using a simple formula:
Number_of_processes_delayed / Number_of_processes_running * 100
In order to read the indicator, we should normally execute the above queries separately. However, by using a trick, we will try to do it with one query. In the first step, we will define a view that reads the number of all tasks being performed:
CREATE VIEW RUNNING_PROC_COUNT AS
SELECT
COUNT(*) AS PROCESS_COUNT
FROM
V_ACTIVITY_INST
WHERE
AI_FINISHED = 0
In the next step, we will execute a query that returns the given pointer.
SELECT
ROUND(COUNT(AI_ID)/ SUM(PROCESS_COUNT) * 100, 2) AS " Delayed tasks [%]"
FROM
V_ACTIVITY_INST ,
RUNNING_PROC_COUNT
WHERE
AI_FINISHED = 0 AND
AI_PLANNED_FINISH_DATE < CURRENT_DATE - 10
Since the RUNNING_PROC_COUNT view always returns 1 tuple, the query returns the correct pointer. To enable data aggregation, we made the sum of the values returned by the RUNNING_PROC_COUNT view equal to the returned (one) tuple.
Reporting
In the docuRob®WorkFlow system, reporting enables the extraction of data on the definition and execution of processes in a single form and graphic design. This data is presented in the form of a report. In addition to the report definition itself, it is crucial to prepare a query providing data (the so-called data source ) and to define appropriate report selection criteria.
Below are some examples of report data source definitions based on the Process Repository. In order to use the presented queries, it is best to define them as new views in the Process Repository. Sorting on these views must be done directly in the report definition (outside the view).
Example No. 1
Purpose : Statistics of work of individual employees specified in terms of tasks performed (completed) by them in a given time period. The report should take into account substitutions and be able to be prepared for employees of a given organization or organizational unit.
Implementation : In order to define the query, first let's define the data to be retrieved. This data will be represented by individual fields (columns) of the views available in the Process Repository. The list of columns must include the fields that will be displayed in the report or are selection criteria for this report. In our example, we assume that the report will display the name of the actual task performer and the so-called logical task performer, i.e. the person who was supposed to perform this task. In other words, this will be information about the substitute (who actually performed it) and the substituted (who was supposed to perform it). In addition to this data, the report should also include data on the number of tasks performed in a given period of time.
As for the criteria, in accordance with the requirements, we assume that these will be attributes of the logical task performer represented by attributes attr1 (organization identifier) and attr2 (organizational unit identifier). The next criterion will be the task completion date - we will only count tasks that have already been completed. Due to data grouping, we will not add date criteria to the query, otherwise the grouping would not work.
The query implementing our assumptions is as follows:
SELECT
AI_PERFORMER_NAME,
AI_PERFORMER_ATTR1,
AI_PERFORMER_ATTR2,
AI_LOG_PERFORMER_NAME,
AI_LOG_PERFORMER_ATTR1,
AI_LOG_PERFORMER_ATTR2,
COUNT(*)
FROM
V_ACTIVITY_INST
WHERE
 AI_FINISHED = 1 AND
 AI_STATUS = 1 AND
 AI_FINISHED_DATE BETWEEN <data_od> AND <data_do>
GROUP BY
 AI_PERFORMER_NAME,
 AI_PERFORMER_ATTR1,
 AI_PERFORMER_ATTR2,
 AI_LOG_PERFORMER_NAME,
 AI_LOG_PERFORMER_ATTR1,
 AI_LOG_PERFORMER_ATTR2
NOTE. Subtraction between dates presented in the example works on the PostgreSQL server. For other servers, it may be necessary to predefine this expression. Dates and real numbers are such values that they are not suitable for data aggregation elements. Most often, aggregation concerns only selected parts of such values (e.g. day, month)
Example No. 2
Purpose : List of tasks delayed by more than a given number of days. Information about the task performers. Consideration of replacements. Information about the time the task was created, the time it was started and the planned time of its completion. Consideration of tasks within a specified time range, for employees of a given organization and/or organizational unit.
Execution : Unlike the previous report, this one is a report that filters data and does not aggregate it. The data that will be presented in the report includes the following columns: performer name (logical and physical), task creation date, task start date, planned task completion date. The current delay, which will definitely be in the report definition, is best defined as a field calculated in the definition itself based on the planned completion date and the current report generation date.
The report selection criteria are similar to the previous criteria and include attributes of the logical performer of the task represented by attr1 (organization ID) and attr2 (organizational unit ID), task creation date, and task start date.
SELECT
AI_PERFORMER_NAME,
AI_PERFORMER_ATTR1,
AI_PERFORMER_ATTR2,
AI_LOG_PERFORMER_NAME,
AI_LOG_PERFORMER_ATTR1,
AI_LOG_PERFORMER_ATTR2,
AI_CREATED_DATE,
AI_STARTED_DATE,
AI_PLANNED_FINISH_DATE
FROM
V_ACTIVITY_INST
WHERE
AI_FINISHED = 0 AND
AI_PLANNED_FINISH_DATE < CURRENT_DATE - < specified_number_of_days >
In the <specified_number_of_days> field, insert the appropriate date in the format supported by the database. In the case of the PostgreSQL server, this is a date in the format 'YYYY-MM-DD', e.g. '2008-09-23'.
Process workload analysis
The main goal of process workload analysis is to identify situations requiring improvement. In order to identify such situations, data from process execution is analysed. Analysis is most often performed on different types of processes at once. Due to the possible large amount of this data, the analysis is limited to a specific time period. The next step following the analysis is usually a proposal for improving the process(es) resulting in an update of the definition.
Below are some real-world examples that drive such analysis.
Example 1 – Characteristics of employee work – high inertia in task execution
Objective : One of the elements requiring analysis in order to perform load balancing activities is to identify performers whose tasks are started with a significant delay in relation to the time of their creation.
Implementation : It is practically assumed that the start time of a task in the standard case should not exceed one day. The query will be an aggregate query, where we will provide the average, minimum and maximum time between the creation of the task and its start. We will filter performers for whom the average such time exceeds 4 hours. For the sake of simplicity, we will take into account all tasks completed correctly.
SELECT
AI_PERFORMER_NAME,
AI_LOG_PERFORMER_NAME,
MIN(AI_STARTED_DATE-AI_CREATED_DATE),
AVG(AI_STARTED_DATE-AI_CREATED_DATE),
MAX(AI_STARTED_DATE-AI_CREATED_DATE)
FROM
V_ACTIVITY_INST
WHERE
AI_FINISHED= 1 AND
AI_STATUS = 1
GROUP BY
AI_PERFORMER_NAME,
AI_LOG_PERFORMER_NAME
HAVING
AVG(AI_STARTED_DATE-AI_CREATED_DATE) > 1
In order to filter out performers for whom the average time difference between task creation and start is greater than one day, the HAVING clause was used.
Example 2 – Employee Work Characteristics – Long Task Queues
Goal : To identify performers whose task waiting time in the queue for execution constitutes more than 50% of the entire task execution time (from creation to completion).
Execution : In this case, we will check completed tasks for performers whose average waiting time in the queue is greater than 50% of the average execution time of the entire task.
SELECT
AI_PERFORMER_NAME,
AI_LOG_PERFORMER_NAME,
AVG(AI_STARTED_DATE-AI_CREATED_DATE),
AVG(AI_FINISHED_DATE - AI_CREATED_DATE)
FROM
V_ACTIVITY_INST
WHERE
AI_FINISHED= 1 AND
AI_STATUS = 1
GROUP BY
AI_PERFORMER_NAME,
AI_LOG_PERFORMER_NAME
HAVING
AVG(AI_STARTED_DATE-AI_CREATED_DATE) * 2 > AVG(AI_FINISHED_DATE - AI_CREATED_DATE)
The 50% threshold was defined as half of the value of the entire process execution time and the HAVING clause was used to filter the aggregated data.
Example 3 – Employee Work Characteristics – Idleness Detection
Purpose : To identify performers who do not perform tasks in the system for a period of time longer than a defined threshold.
Implementation : Practically, the check applies to distribution tasks where long task execution time is not required. In this way, we avoid an erroneous indicator that would give incorrect data in the case of tasks requiring a lot of work outside the process (e.g. preparation of the decision document, meetings and teleconferences, etc.). Downtime in task execution will be counted in terms of the task completion date.
SELECT
A.AI_PERFORMER_NAME as "Person",
A.AI_STARTED_DATE as "Starting point",
B.AI_STARTED_DATE as "Next point",
B.AI_STARTED_DATE - A.AI_STARTED_DATE as "Downtime [HH:MM:SS]"
FROM
V_ACTIVITY_INST as A, V_ACTIVITY_INST as B
WHERE
  A.AI_STARTED_DATE >= <data_od> AND
  A.AI_STARTED_DATE <= <data_do> AND
  A.AI_PERFORMER_ID <> '-1' AND – no_automatic_performer (system)
 A.AI_STARTED_DATE <
 	(SELECT MIN(C.AI_STARTED_DATE)
 	  FROM V_ACTIVITY_INST as C
	  WHERE C.AI_STARTED_DATE > A.AI_STARTED_DATE AND
		  C.AI_PERFORMER_ID = A.AI_PERFORMER_ID)
       - '25min'::interval AND
  B.AI_STARTED_DATE =
 	(SELECT MIN (C.AI_STARTED_DATE)
 	  FROM V_ACTIVITY_INST as C
	WHERE C.AI_STARTED_DATE > A.AI_STARTED_DATE AND
		C.AI_PERFORMER_ID = A.AI_PERFORMER_ID) AND
B.AI_PERFORMER_ID = A.AI_PERFORMER_ID
ORDER BY
"Person", "Starting Point", "Downtime [HH:MM:SS]"
The algorithm of action is as follows:
- take a task from a specified time range performed (or completed) by any employee of the organization (but not a system performing automated tasks). it is a tuple in object A.
- the successor of the selected task must be the task closest in time to this task (aggregation via MIN functions and a condition on the start time ( tuple in object C), executed by the same employee). Additionally, process ( tuple from object A) only those tasks for which the successor is more than 25 minutes away.
- as a result of execution, the task that is the successor of the analysed task ( tuple in object B) is also returned. To do this, select again the task that is the successor to the analysed task in a manner analogous to that described above.
Example 4 – Characteristics of the organization's work
Objective : Understanding the characteristics of the organization's work expressed in terms of the number of tasks created in a given period of time. Individual working hours and working days during the week are taken into account. Such information allows for better planning of the use of IT resources, for example, in the moments of so-called system use peaks, the execution of automatic actions and system administration should be reduced to a minimum.
Implementation : Information about the characteristics of the work will be collected based on data about the tasks created in a given period of time. Grouping and counting of tasks will be done based on date (year, month, day) and time.
SELECT
EXTRACT(DAY FROM AI_FINISHED_DATE) as "Day",
EXTRACT(HOUR FROM AI_FINISHED_DATE)as "Hour",
COUNT(*) as " Number of tasks completed"
FROM
V_ACTIVITY_INST
WHERE
AI_FINISHED_DATE BETWEEN < date_from > AND < date_to >
GROUP BY
EXTRACT(DAY FROM AI_FINISHED_DATE),
EXTRACT(HOUR FROM AI_FINISHED_DATE)
ORDER BY
EXTRACT(DAY FROM AI_FINISHED_DATE),
EXTRACT(HOUR FROM AI_FINISHED_DATE)
To extract the day and time, the EXTRACT function, specific to the PostgreSQL server, was used. For other servers, you will need to use other functions.
Example 5 – Characteristics of the workload of organizational units
Objective : Understanding the characteristics of workload of an organizational unit expressed in terms of the number of tasks created in a given period of time. Individual working hours and working days during the week are taken into account. Such information allows for better planning of the use of IT resources, for example, in the moments of so-called system use peaks, the performance of automatic and administrative activities should be reduced to a minimum.
Implementation : Information about the characteristics of the workload will be collected based on data about tasks created in a given period of time. Grouping and counting of tasks will be done based on date (year, month, day) and time.
SELECT
EXTRACT(DAY FROM AI_FINISHED_DATE) as "Day",
EXTRACT(HOUR FROM AI_FINISHED_DATE)as "Hour",
 AI_PERFORMER_ATTR1 as "Organizacja",
 AI_PERFORMER_ATTR2 as "Komórka organizacyjna",
 COUNT(*) as "Liczba zadań zakończonych"
FROM
 V_ACTIVITY_INST
WHERE
 AI_FINISHED_DATE BETWEEN <data_od> AND <data_do>
GROUP BY
 EXTRACT(DAY FROM AI_FINISHED_DATE),
 EXTRACT(HOUR FROM AI_FINISHED_DATE),
 AI_PERFORMER_ATTR1,
 AI_PERFORMER_ATTR2
ORDER BY
 AI_PERFORMER_ATTR1,
 AI_PERFORMER_ATTR2,
 EXTRACT(DAY FROM AI_FINISHED_DATE),
EXTRACT(HOUR FROM AI_FINISHED_DATE)
In the <date_from> and <date_to> fields , enter specific date values according to the format supported by the database server.
Identification of exceptional situations
Sometimes processes are performed incorrectly. This usually happens because of an incorrect definition of the process or its environment. In the case of the process environment, exceptional situations are related to the unavailability or errors of services performed, designated performers and processed data. Processes and their tasks performed incorrectly are suspended or interrupted. After such situations occur, they are analysed and the results of such analysis are the basis for improving or optimizing the process.
Example No. 1
Objective : Identify activities that are most frequently suspended.
Execution : To execute this task, we will use the task status information. If the task has been paused, then its status is 4. So, we will find all tasks with this status and group them by the activity of which these tasks are instances.
SELECT
AI_AD_NAME,
COUNT(*)
FROM
V_ACTIVITY_INST
WHERE
AI_FINISHED= 1 AND
AI_STATUS = 4
GROUP BY
AI_AD_NAME
ORDER BY
COUNT(*) DESC
Example No. 2
Objective : To identify the scale of interrupted processes, divided into individual process types and versions.
Implementation : In order to perform this task, we will use information about the status of processes. If the process has been interrupted, its status is equal to 2. We will count such processes by the name of the process definition and the version number.
SELECT
PD_NAME,
PD_VERSION,
COUNT(*)
FROM
V_PROCESS_INST, V_PROCESS_DEF
WHERE
PI_FINISHED= 1 AND
PI_STATUS = 4 AND
PD_ID = PI_PD_ID
GROUP BY
PD_NAME,
PD_VERSION
ORDER BY
COUNT(*) DESC
Analytical query performance
With a large amount of data, in order to perform queries on the Process Repository, it is crucial to set appropriate restrictive conditions. They have a large impact on the speed of the search.
A given condition defined on a specific attribute (attributes) has two effects on reducing query execution time:
- significantly reduces the number of records processed,
- enables the use of the index for faster data retrieval.
The fastest queries are those that search for data by key, both primary and foreign. Since all keys are indexed, the system's response is immediate.
To help you construct effective queries, the following table provides a set of guidelines for the most popular fields used to search for data in the Process Repository.
| Column name | How is it indexed | How it affects the narrowing of the number of records returned | Additional comments |
|---|---|---|---|
| PI_CREATED_DATE | Recommended for range searches, i.e. from-to. | Significantly. It is recommended to set this criterion to a specific range, preferably day, week, month. | |
| PI_STATUS | Recommended for specifying a specific value or list of values. Most often searching for tasks created but not started. | Significantly. | It is recommended that, whenever possible, this criterion is always included in the query. |
| AI_CREATED_DATE | Recommended for range searches, i.e. from-to. | Significantly. It is recommended to set this criterion to a specific range, preferably day, week, month. | |
| AI_START_DATE | Recommended for range searches, i.e. from-to. | Significantly. It is recommended to set this criterion to a specific range, preferably day, week, month. | If a criterion is set to the task creation date, then this criterion gives the minimum speedup. |
| AI_FINISHED_DATE | Recommended for range searches, i.e. from-to. | Significantly. It is recommended to set this criterion to a specific range, preferably day, week, month. | If a criterion is set to task creation or start date, this criterion gives the minimum acceleration. |
| AI_FINISHED | Recommended for specifying a specific value. Most often searching for tasks performed. | Significantly, because the number of tasks processed is negligible in relation to all tasks stored in the Repository. | It is recommended that, whenever possible, this criterion is always included in the query. |
| AI_STATUS | Recommended for specifying a specific value or list of values. Most often searching for tasks created but not started. | Significantly, as is the task completion status. | It is recommended that, whenever possible, this criterion is always included in the query. If a criterion is set to completion status, this criterion does not introduce a significant acceleration - exception - interrupted tasks. |
Table 9. Guidelines for using the fields contained in the Process Repository
Workload modeling
The basic resource of business processes managed on the docuRob®WorkFlow platform are the organization's employees performing tasks in the processes. Workload modeling is conducted from the perspective of process tasks performed by authorized users with appropriate skills (competencies) performing roles assigned to them within a given process or processes.
Depending on the type of activity covered by business processes, roles can be assigned in the context of the organizational structure and appropriately mapped to process definitions. In a BPMN diagram, the roles of process participants are presented in appropriate swimlanes or marked with assigned colours. The latter method leads to much more readable graphical process models.
The set of performers of a process task performing a role associated with it may contain dynamically determined subsets of performers resulting from the need to take into account additional attributes, for example competencies.
An example could be the model of the publishing process where, as part of the role of the editor, we must also take into account the scientific specialization and knowledge of the language in which the publication is written.
When designing or reorganizing the configuration of process participant roles, it is helpful to use the OLAP ( online analytical processing) methodology and tools, while for designing or optimization existing processes where information is needed regarding the impact of designer decisions on workload metrics, we provide support within the docuRob®WorkFlow platform process design tool.
Analysis of the multidimensional process execution model
Multidimensional analysis of the process execution model requires access to a properly prepared structure of logs of completed tasks. Log information concerning business processes used in an organization provides input data for the OLAP cube schema. Queries executed based on this schema provide the actual workload characteristics*.*
The environment prepared in this way allows management and the relevant process owners to perform ongoing analysis of the workload and to identify potential anomalies occurring in this area. The structure of the object classes prepared for processing of the process execution log is shown in Figure 7 , and the diagram of the OLAP cube enabling the analysis is included in Figure 8 .
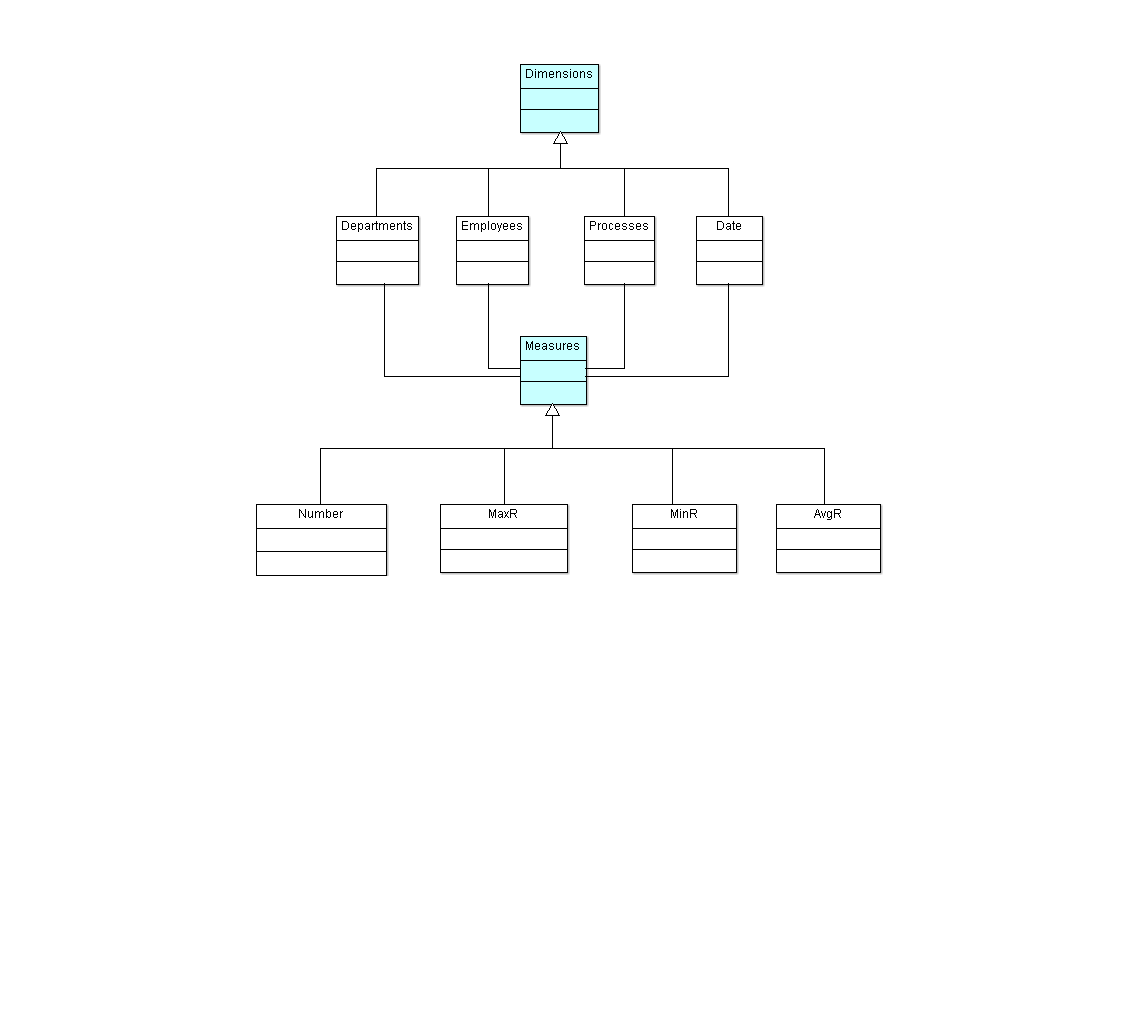
Figure 7. Class diagram of the multidimensional event log analysis model (MDX)
The MDX query that results in an expanded analytical view containing controls that allow dynamic expansion and collapse of appropriate model fragments is shown in The query materializes the analysis interface is shown in Figure 10. According to the adopted model of the process log structure, the following appropriately aggregated metrics are made available at each level of the model :
- Number of task instances – number of tasks executed at a given aggregation level
- MaxR maximum residence time of a task – maximum residence time of a task (1) at a given aggregation level
- MinR is the minimum residence time of a task at a given aggregation level.
- AvgR is the average residence time of a task at a given aggregation level.
(1) Residency time includes time in queue + time to complete the task
Aggregation includes metric values from the level of an individual task participant to the entire organization. Transitions between model aggregation levels are performed by model users through appropriate controls +
The lower screen of Figure 10 shows the expanded Process of handling correspondence in the cell aggregated at the task type level. This level of aggregation includes all employees of a given organizational unit.
Schema name =" docman ">
<Cube name="OfficeObjects WorkFlow Processes" cache="true" enabled="true">
 <Table name="v_cz_finished_manual" schema="docman"/>
<Dimension name="Departments" foreignKey="icz_podmiot_attr2">
<Hierarchy hasAll="true" allMemberName="All Departments" primaryKey="child_id">
 <Table name="as_zw_komorek_aktywne" schema="docman"/>
<Level name="Department" uniqueMembers="true" column="child_id" nameColumn="name" type="Numeric" parentColumn="parent_id" nullParentValue="0">
<Closure parentColumn="parent_id" childColumn="child_id">
 <Table name="as_zw_komorek_aktywne_closure"/>
 </Closure>
 </Level>
 </Hierarchy>
 </Dimension>
<Dimension type="StandardDimension" name="Employees">
<Hierarchy hasAll="true" allMemberName="All Employees">
 <Level name="Employee" column="icz_podmiot_nazwa" type="String" uniqueMembers="true" levelType="Regular" hideMemberIf="Never"/>
 </Hierarchy>
 </Dimension>
<Dimension type="StandardDimension" foreignKey="icz_id" name="Processes">
<Hierarchy hasAll="true" allMemberName="All Processes" primaryKey="icz_id" primaryKeyTable="tb_act_inst_finished_manual">
<Join leftAlias="tb_act_inst_finished_manual" leftKey="icz_pp_id" rightAlias="tb_process_def" rightKey="pd_id">
 <Table name="tb_act_inst_finished_manual" schema="docman"/>
 <Table name="tb_process_def" schema="docman"/>
 </Join>
 <Level name="Process" table="tb_process_def" column="pd_name" type="String" uniqueMembers="true" levelType="Regular" hideMemberIf="Never"/>
 <Level name="Activity" table="tb_act_inst_finished_manual" column="icz_name" type="String" uniqueMembers="true" levelType="Regular" hideMemberIf="Never"/>
 <Level name="Instance" table="tb_act_inst_finished_manual" column="icz_id" type="String" uniqueMembers="true" levelType="Regular" hideMemberIf="Never"/>
 </Hierarchy>
 </Dimension>
<Dimension type="TimeDimension" foreignKey="icz_data_rozp" name="Date">
<Hierarchy name="YQMD" hasAll="true" allMemberName="All Dates" primaryKey="time_stp">
 <Table name="date_time" schema="docman"/>
 <Level name="Year" column="year" type="Numeric" uniqueMembers="true" levelType="TimeYears" hideMemberIf="Never"/>
 <Level name="Quarter" column="quoter" type="Numeric" uniqueMembers="false" levelType="TimeQuarters" hideMemberIf="Never" captionColumn="quoter_label"/>
 <Level name="Month" column="month" type="Numeric" uniqueMembers="false" levelType="TimeMonths" hideMemberIf="Never" captionColumn="month_label"/>
 <Level name="Day" column="day" type="Numeric" uniqueMembers="false" levelType="TimeDays" hideMemberIf="Never"/>
 </Hierarchy>
 </Dimension>
 <Measure name="Number" column="icz_finished" datatype="Integer" aggregator="count" visible="true"/>
 <Measure name="MaxR" column="icz_residence_time" datatype="Numeric" formatString="#,###0.00" aggregator="max" visible="true"/>
 <Measure name="MinR" column="icz_residence_time" datatype="Numeric" formatString="#,###0.00" aggregator="min" visible="true"/>
 <Measure name="AvgR" column="icz_residence_time" datatype="Numeric" formatString="#,###0.00" aggregator="avg" visible="true"/>
 </Cube>
 </Schema>
Figure 8. Multidimensional Log Analysis Model (MDX) Schema
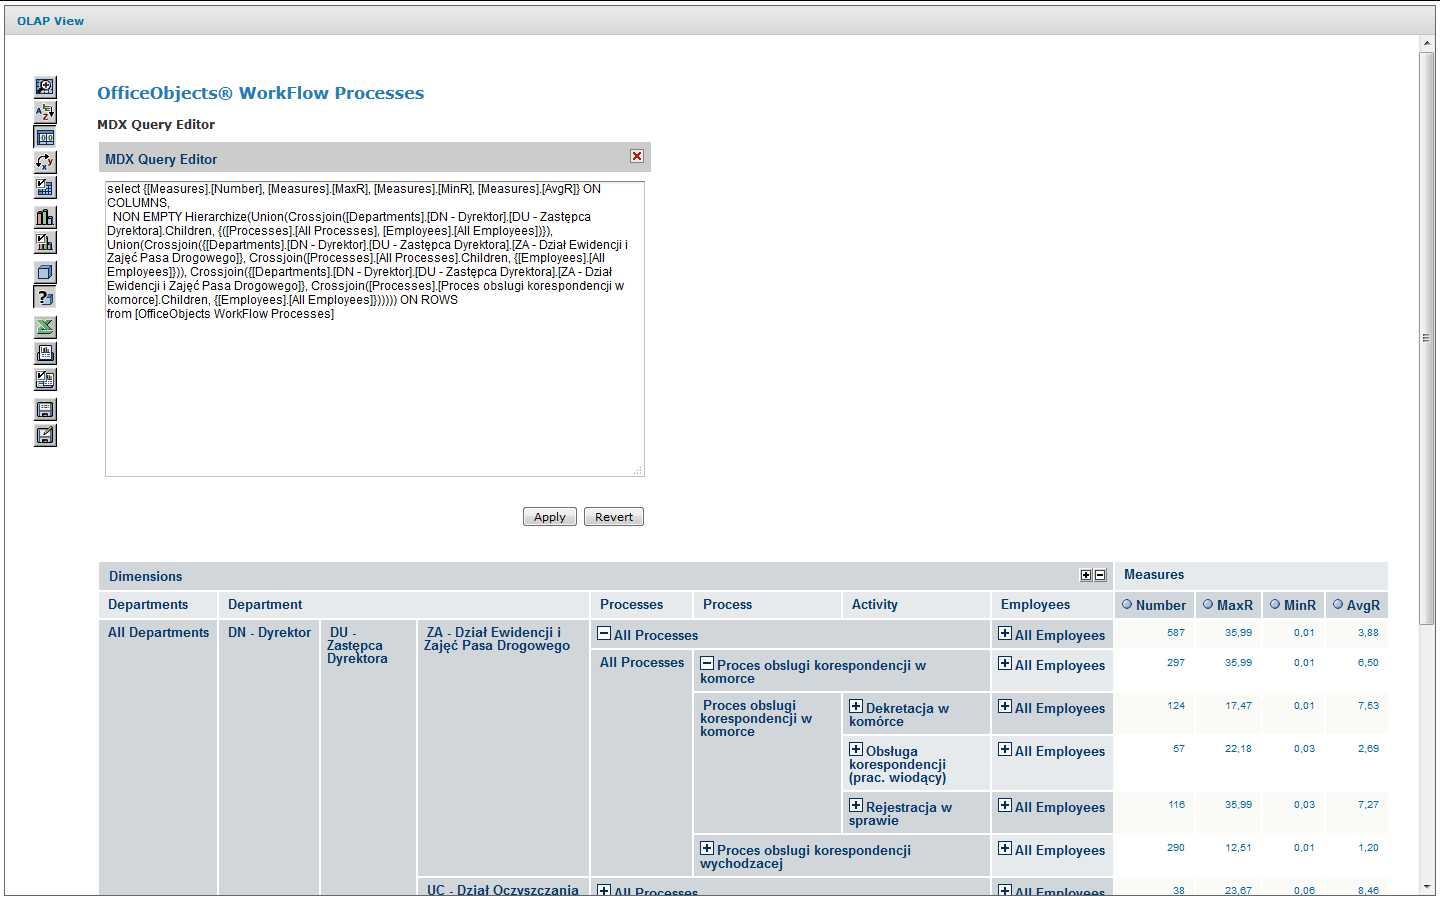
Figure 9. MDX query materializing the analytical view on the bottom screen Figure 10
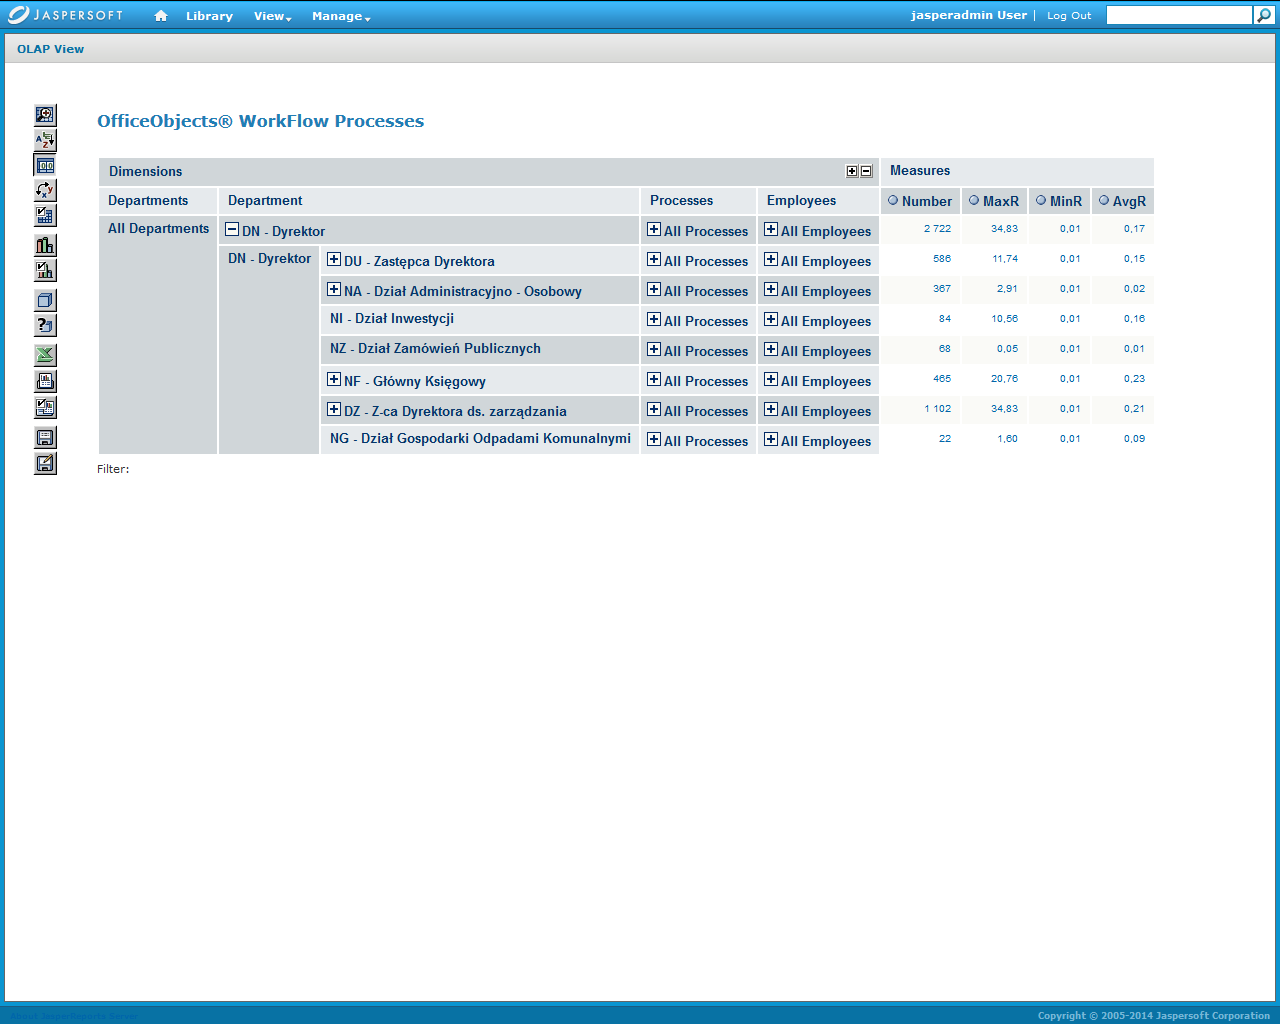
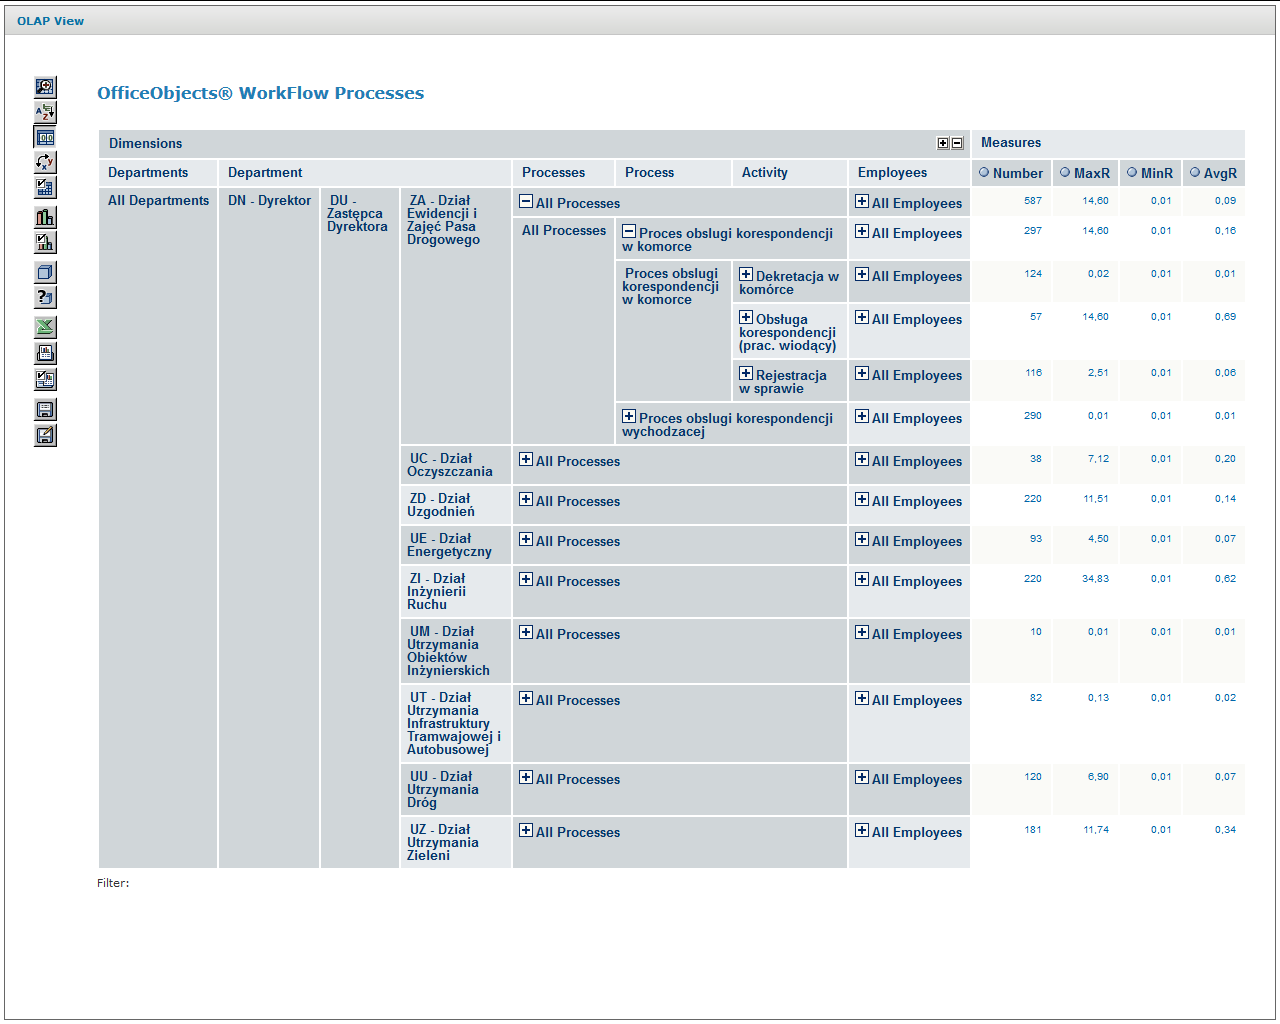
Figure 10. Input and expanded screens of multidimensional process log analysis
The load analysis presented above was performed with the use of the Mondrian_3.0 platform based on the Multidimensional Expressions (MDX) language and the jPivot thin client used for the presentation and manipulation of the graphical user interface.
Analytical model of process performance
Monitoring the execution of business processes, both at the level of individual instances and at the OLAP level, can provide sufficient information for analysing the workload of individual user groups acting in different roles as task performers. The workload parameters obtained in this way provide information necessary for tuning performance of process models and solving the execution bottleneck problems.
In practice, we have to conduct ex ante analysis when we need to initially verify newly designed business processes that are critical from the point of view of the workload they must support. Additionally, change management in the realm of operational information systems under maintenance requires the process administration team to respond to significant changes in the workload characteristics.
An example of the latter case would be an anticipated change in the proportion of transaction types handled by individual user roles within one or more related process types that occur concurrently in processing scenarios.
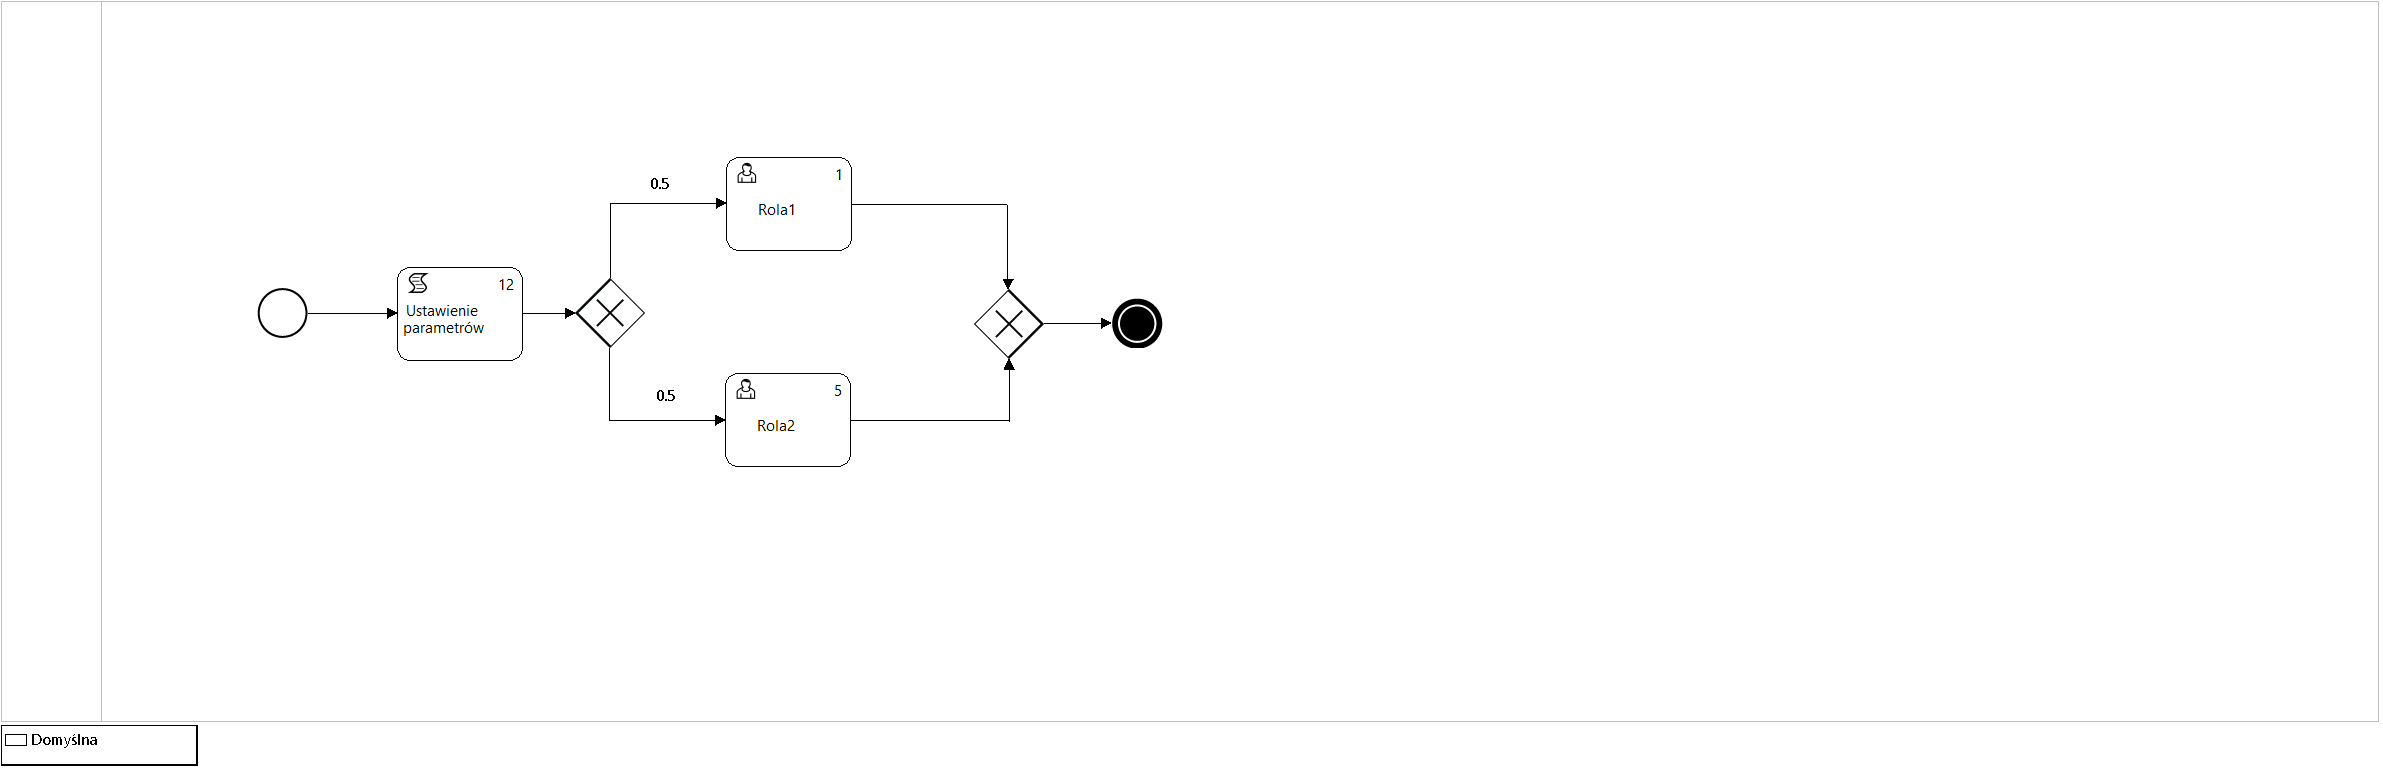
Figure 11. Process model P12_Simulation3
Workload parameters comprise values for metrics such as:
- Average number of concurrent process instances
- Number of executions (visits) of process instance tasks
- Average time it takes to complete a task by a selected performer
Human resource parameters of the process include values such as:
- The role model of task performers defined for a given process type
- The size of the participant set within each role
- The cost factor for completing a given task
The number of task executions is calculated based on a probabilistic process flow model. This parameter is estimated solely for activities performed by users (type User or Manual) on the basis of the flow probabilities of the model.
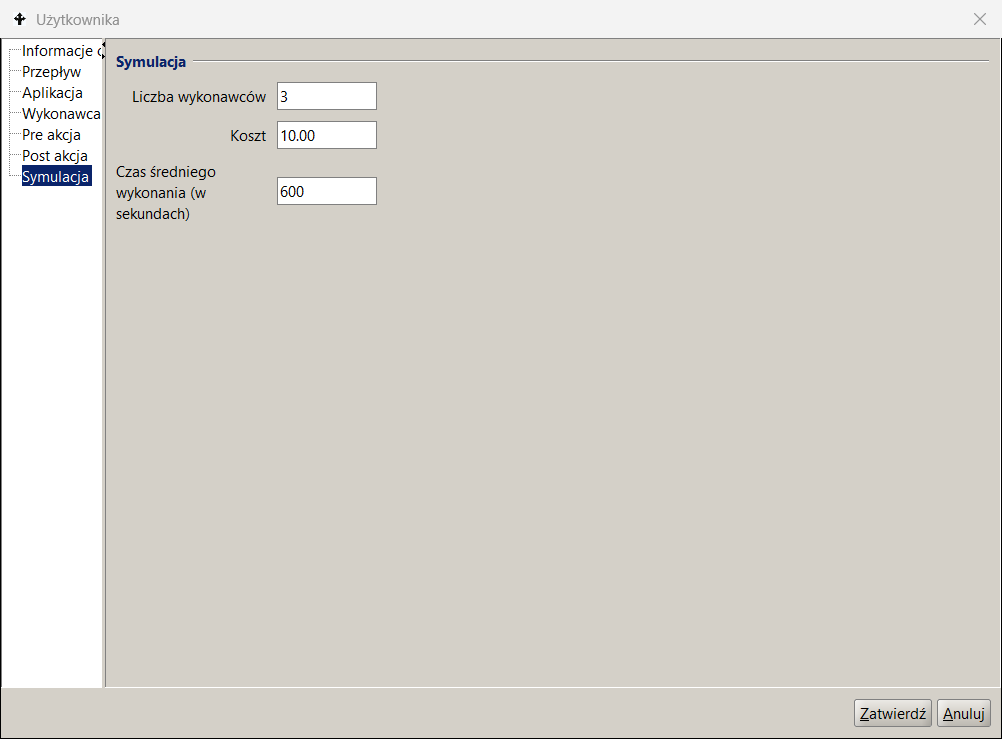
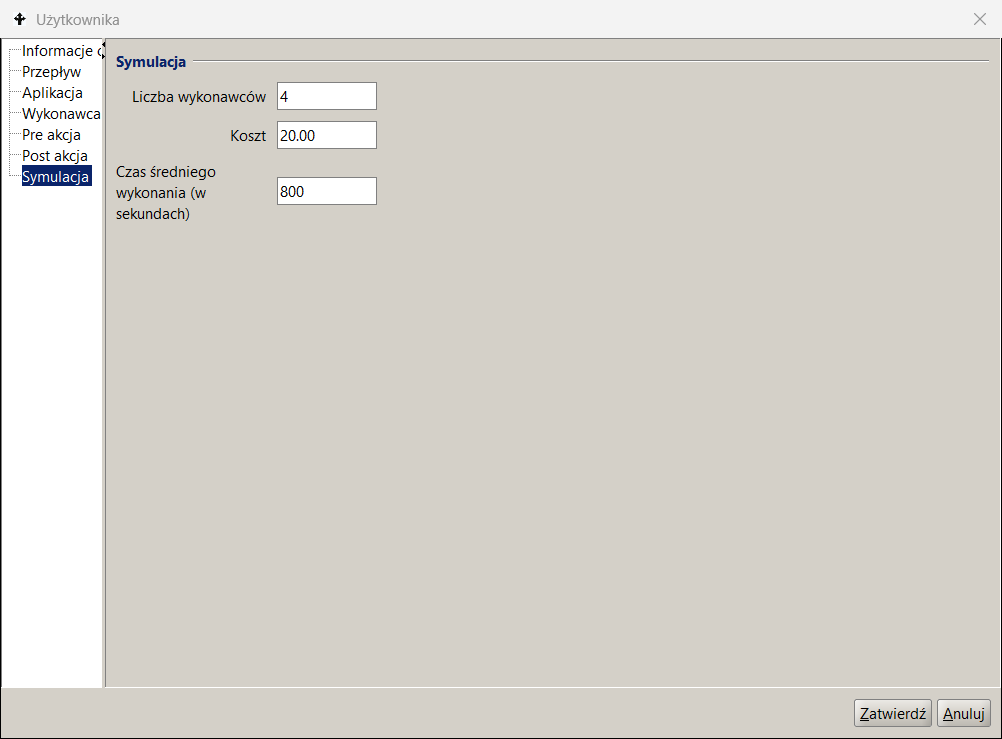
P12_Symulation3 process model , which is used in the example of approximate mean value analysis (MVA) for a closed queueing network, is shown in Figure 11 and the interfaces used for its parameterization are shown in Figure 12 as a set of screens of the docuRob®WorkFlow platform process design tool.
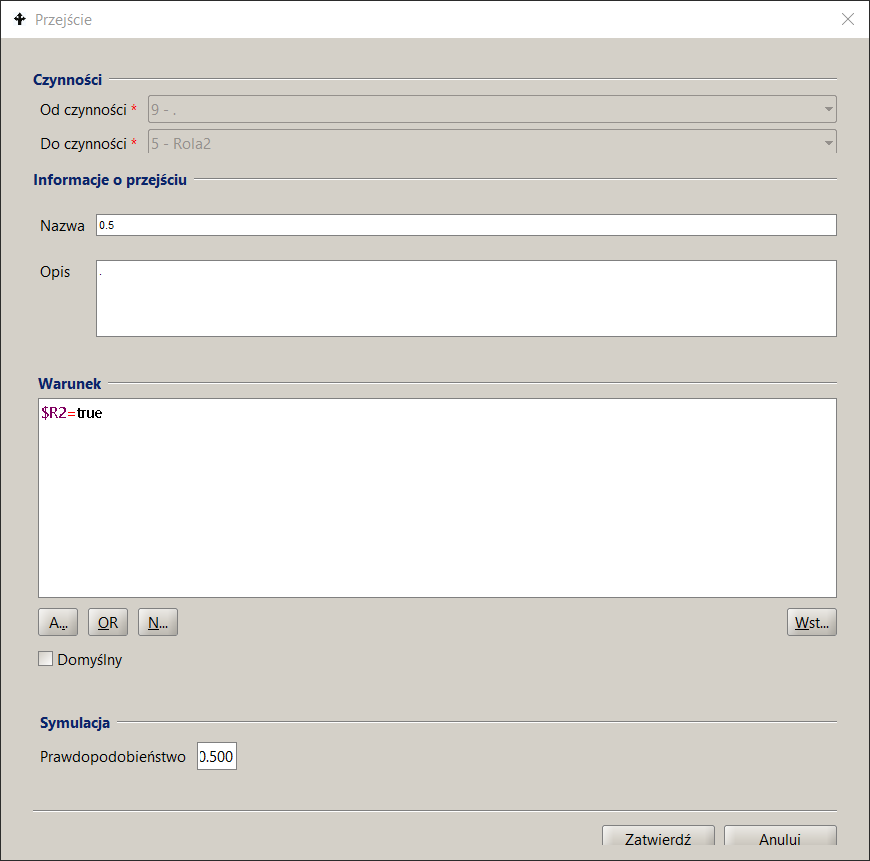
The parameters given in the Simulation tab of the activity description indicate the number of performers belonging to the set of potential participants of the role , i.e. the set of employees selected based on the BPQL work participant assignment (WPA) expression.
Tasks waiting in the queue are assigned to all indicated potential performers by placing them in their respective task lists. After the task is downloaded by one of the potential performers, it is removed from the remaining task lists. The example definition shown in Figure 12 indicates 4 performers of the Role2 activity, which allows modeling 4 concurrent performers of this task, thus estimating reduction in the residence time in the queue to 25% of the nominal metric.
The flow metadata specifies its probability and the sum of the probabilities for all outgoing flows of a given activity must be equal to 1.
Table 10 presents a subset of the values of the MVA algorithm approximate load metrics obtained as a result of 5 scenarios performed for the process model shown in Figure 11. According to the adopted modeling algorithm, task queues are calculated only for tasks performed by users. The green colour indicates the values entered as input parameters of the MVA algorithm, the remaining values are the result of calculations. The resulting values are numerical.
Since the concurrently executed instances of the P12_Simulation3 process contain 2 alternatively selected activities performed by users belonging to one of two roles ( Role1 or Role2 ) and always execute 20 concurrent process instances , the sum of the cardinality of both queues is ~ 20 (differences in further decimal places result from rounding). If a loop occurs in the process model, then the repetitions of activities are also taken into account. The number of concurrent process instances together with the flow probability determine the cardinality of the model queues.
Figure 13 presents a graphical representation of selected result values of one of the executed scenarios of the MVA model. The number of visits is presented for all activities , but they do not take part in the calculations of the queueing model. The queue parameters are expressed as the number of tasks and residence time. The value of the residence time includes the number of tasks in the queue plus the task currently being executed.
The presented example of MVA analysis for a closed queue network illustrates the impact of changes in the workload characteristics , which may result from changes in the frequency of types of provided services. Such a change usually causes modification of flow probabilities, thus a change in the number of visits to individual activities.
Eliminating bottlenecks involves trying to balance the queue lengths and thus equalize the residence times for individual tasks. The summary of results in Table 10 shows a strong impact of queue lengths on the resulting scenario parameters.
Since the execution times of individual tasks are an input parameter whose value can be determined based on the analysis of the currently processes, when looking for optimization we can either manipulate the cardinality of the role participant sets available within individual roles or attempt to change the process model.
Role 1
Task Role2
Transition
Scenario
Figure 12. Process model parameterization
The latter can be achieved by decomposing activities and parallelizing the processing of process tasks or by automating some or all of the user tasks. In our example, the process throughput was increased 5- times by adding 4 performers to Role2.
| ROLE 1 | ROLE 2 | R1 queue (Time) | R2 queue (Time) | R1 queue (Number) | R2 queue (Number) | Process Execution (Average Time) |
|---|---|---|---|---|---|---|
| 1 | 1 | 0,66 | 3,79 | 2,95 | 17,04 | 2,22 |
| 1 | 2 | 3,00 | 0,33 | 17,99 | 2,00 | 1,67 |
| 2 | 2 | 0,33 | 1,89 | 2,95 | 17,04 | 1,11 |
| 3 | 3 | 0,22 | 1,26 | 2,95 | 17,03 | 0,74 |
| 3 | 4 | 0,58 | 0,58 | 9,99 | 9,99 | 0.58 |
*/ Time given in hours
Table 10. Analytical simulation results of 5 MVA analysis scenarios
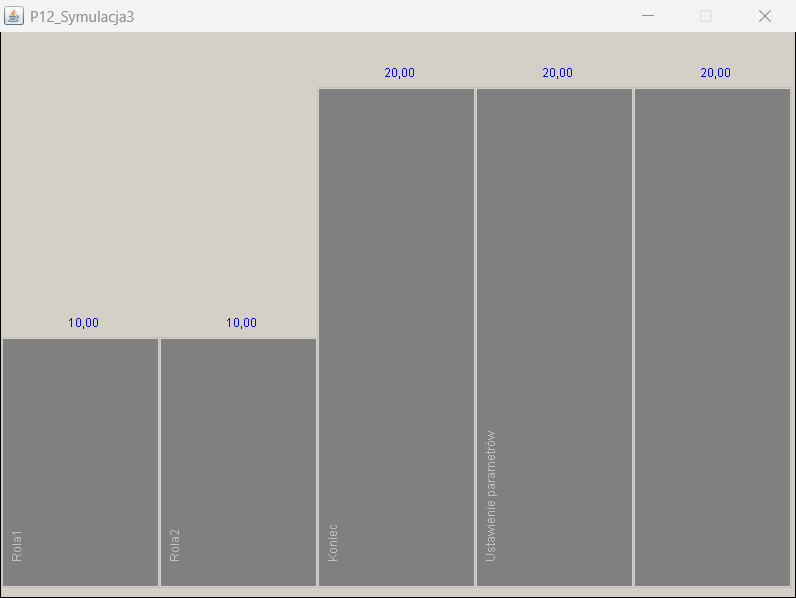
Task instances within the run of 20 process instances
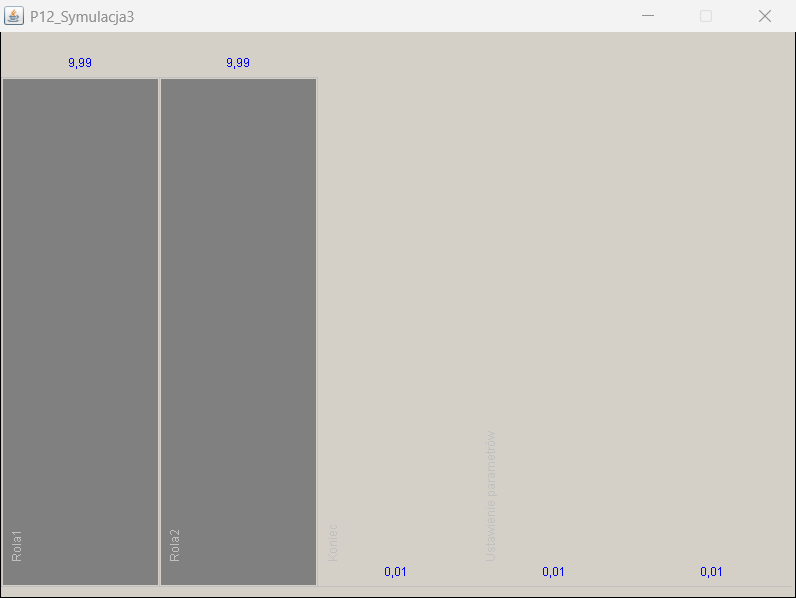
Queues for Role1 and Role2 tasks (task instances)
Residency time for Role1 and Role2 tasks (time in seconds)
Figure 13. Selected results of the analytical simulation.